
Fission Stories #196
Local, state and federal officials post limits on how fast people can drive their vehicles along roads under normal conditions. The posted speed limits are risk-informed because vary from road to road depending on risk factors such as congestion and access options.

Fig. 1 (Source: flickr photo by David Lofink)
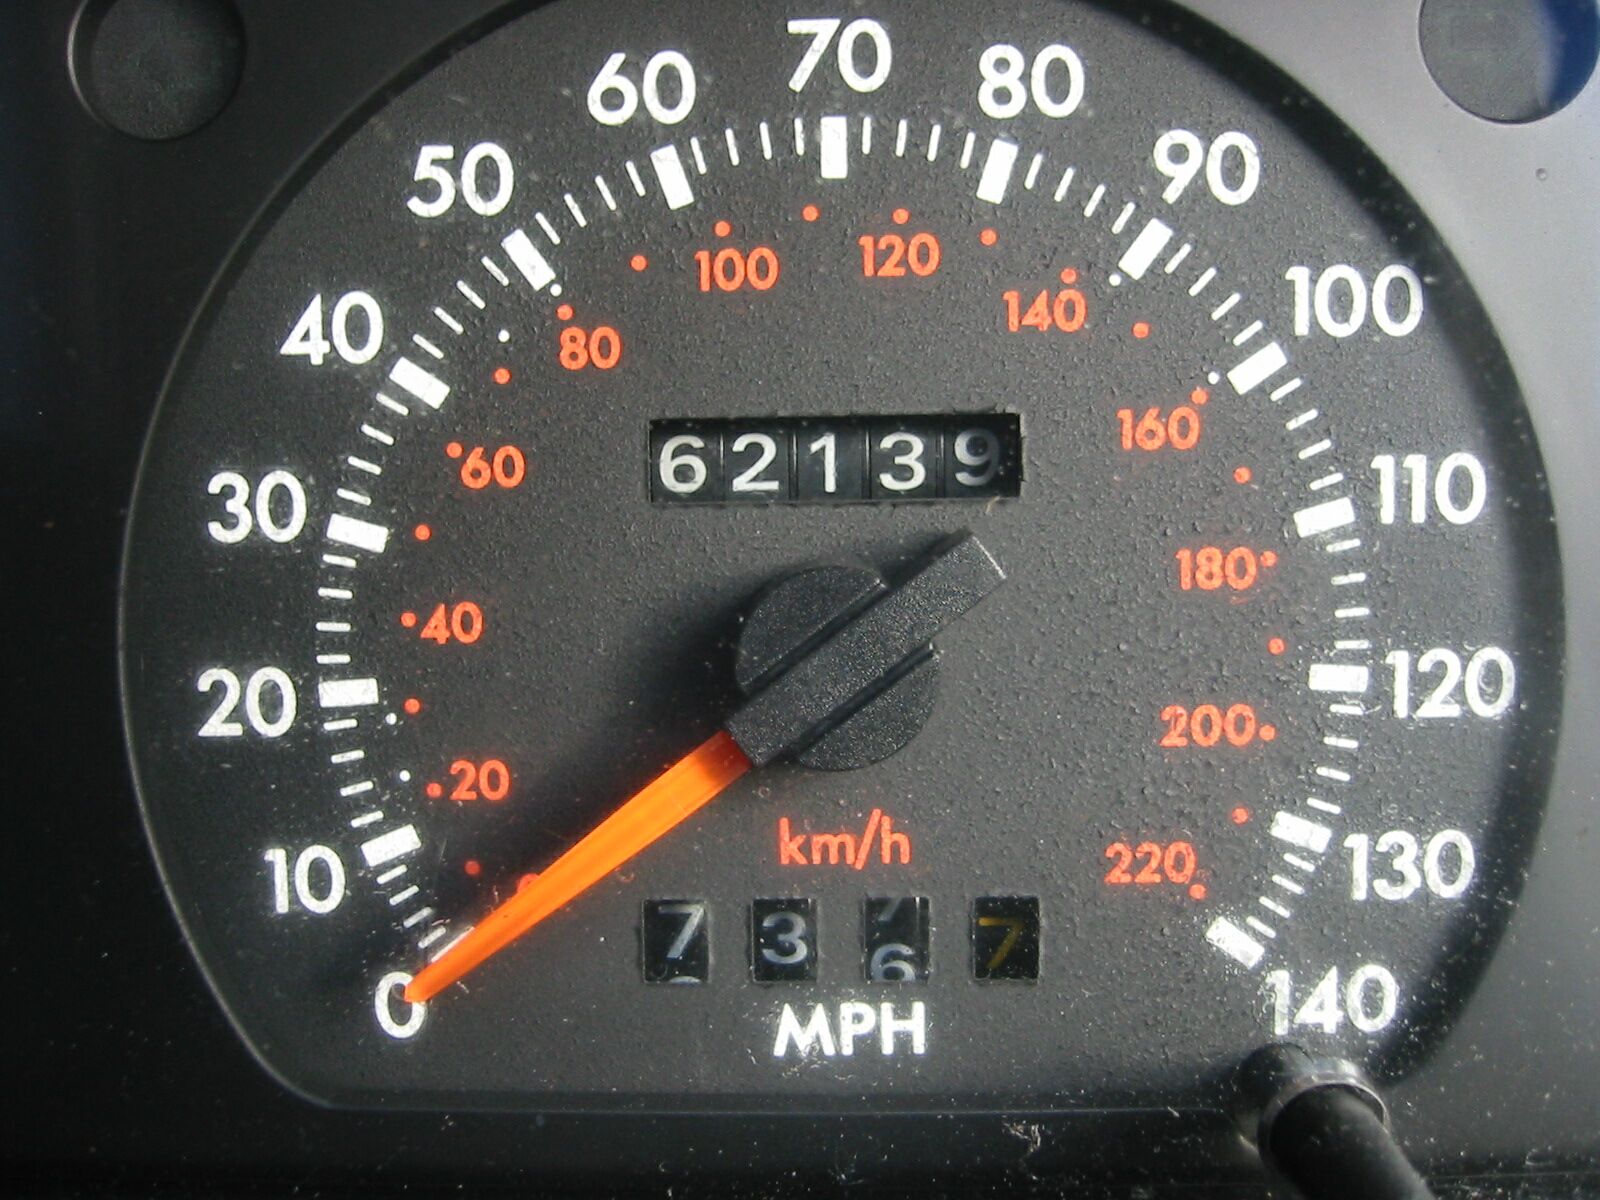
Fig. 2 (Source: flickr photo by _sarchi)
Vehicles are equipped with speedometers (Fig 2) to provide drivers with means to determine whether they are complying with the posted speed limits.
Law enforcement officers have equipment like radar guns (Fig. 3) to give them ways to determine whether drivers are complying with the posted speed limits, too.
When the radar gun reveals a vehicle traveling faster than the posted speed limit, its driver can expect to receive a traffic ticket (Fig. 4)

Fig. 3 (Source: flickr photo by James G)

Fig. 4 (Source: flickr photo by Chris Yarzab)
Nuclear power safety limits
An analogous system is applied to nuclear power plant safety. In the mid 1980s, the NRC adopted safety goals for the operation of nuclear power plants. The NRC also developed two subsidiary safety goals:
- Core damage frequency (CDF) less than 1E-04 per reactor year
- Large early release frequency (LERF) less than 1E-06 per reactor year
The first subsidiary goal addressed odds of a reactor core meltdown. The 1E-04 per reactor year scientific notation nomenclature translates into a likelihood of experiencing a core meltdown no more often than once every 10,000 reactor years.
The second goal addressed the odds of a containment failing to prevent the release of significantly amounts of radioactive materials. The 1E-06 per reactor year nomenclature translates into a likelihood of experiencing a containment failure no more often than once every 1,000,000 reactor years.
If each of these likelihoods can be kept low, the chances of any reactor experiencing a core meltdown that releases large amounts of radioactivity while also experiencing failure of its containment to bottle up that radioactivity are even lower.
These subsidiary safety goals are essentially nuclear speed limits.
Plant owners developed probabilistic risk assessments (PRAs), sometimes called probabilistic safety studies (PSAs), that calculate the core damage frequencies for their reactors. These PRAs function like atomic speedometers in providing owners with something to compare against the nuclear speed limit signs.
The NRC developed Standardized Plant Analysis Risk (SPAR) models that calculate the core damage frequencies for reactors. The NRC has expended considerable effort and resources to understand the difference between PRA and SPAR results for individual reactors and, when appropriate, to narrow those differences. The SPAR models function like radar guns in providing the NRC with something to compare against the nuclear speed limit signs.
Results since 2000
I went back and reviewed the risks calculated by plant owners’ PRAs and NRC’s SPAR models for significant nuclear safety violations identified since the Reactor Oversight Process’ inception in 2000. Basically, I examined yellow and red findings issued by the NRC since 2000.
The red columns are the NRC’s SPAR results. The blue columns are the owners’ PRA results.
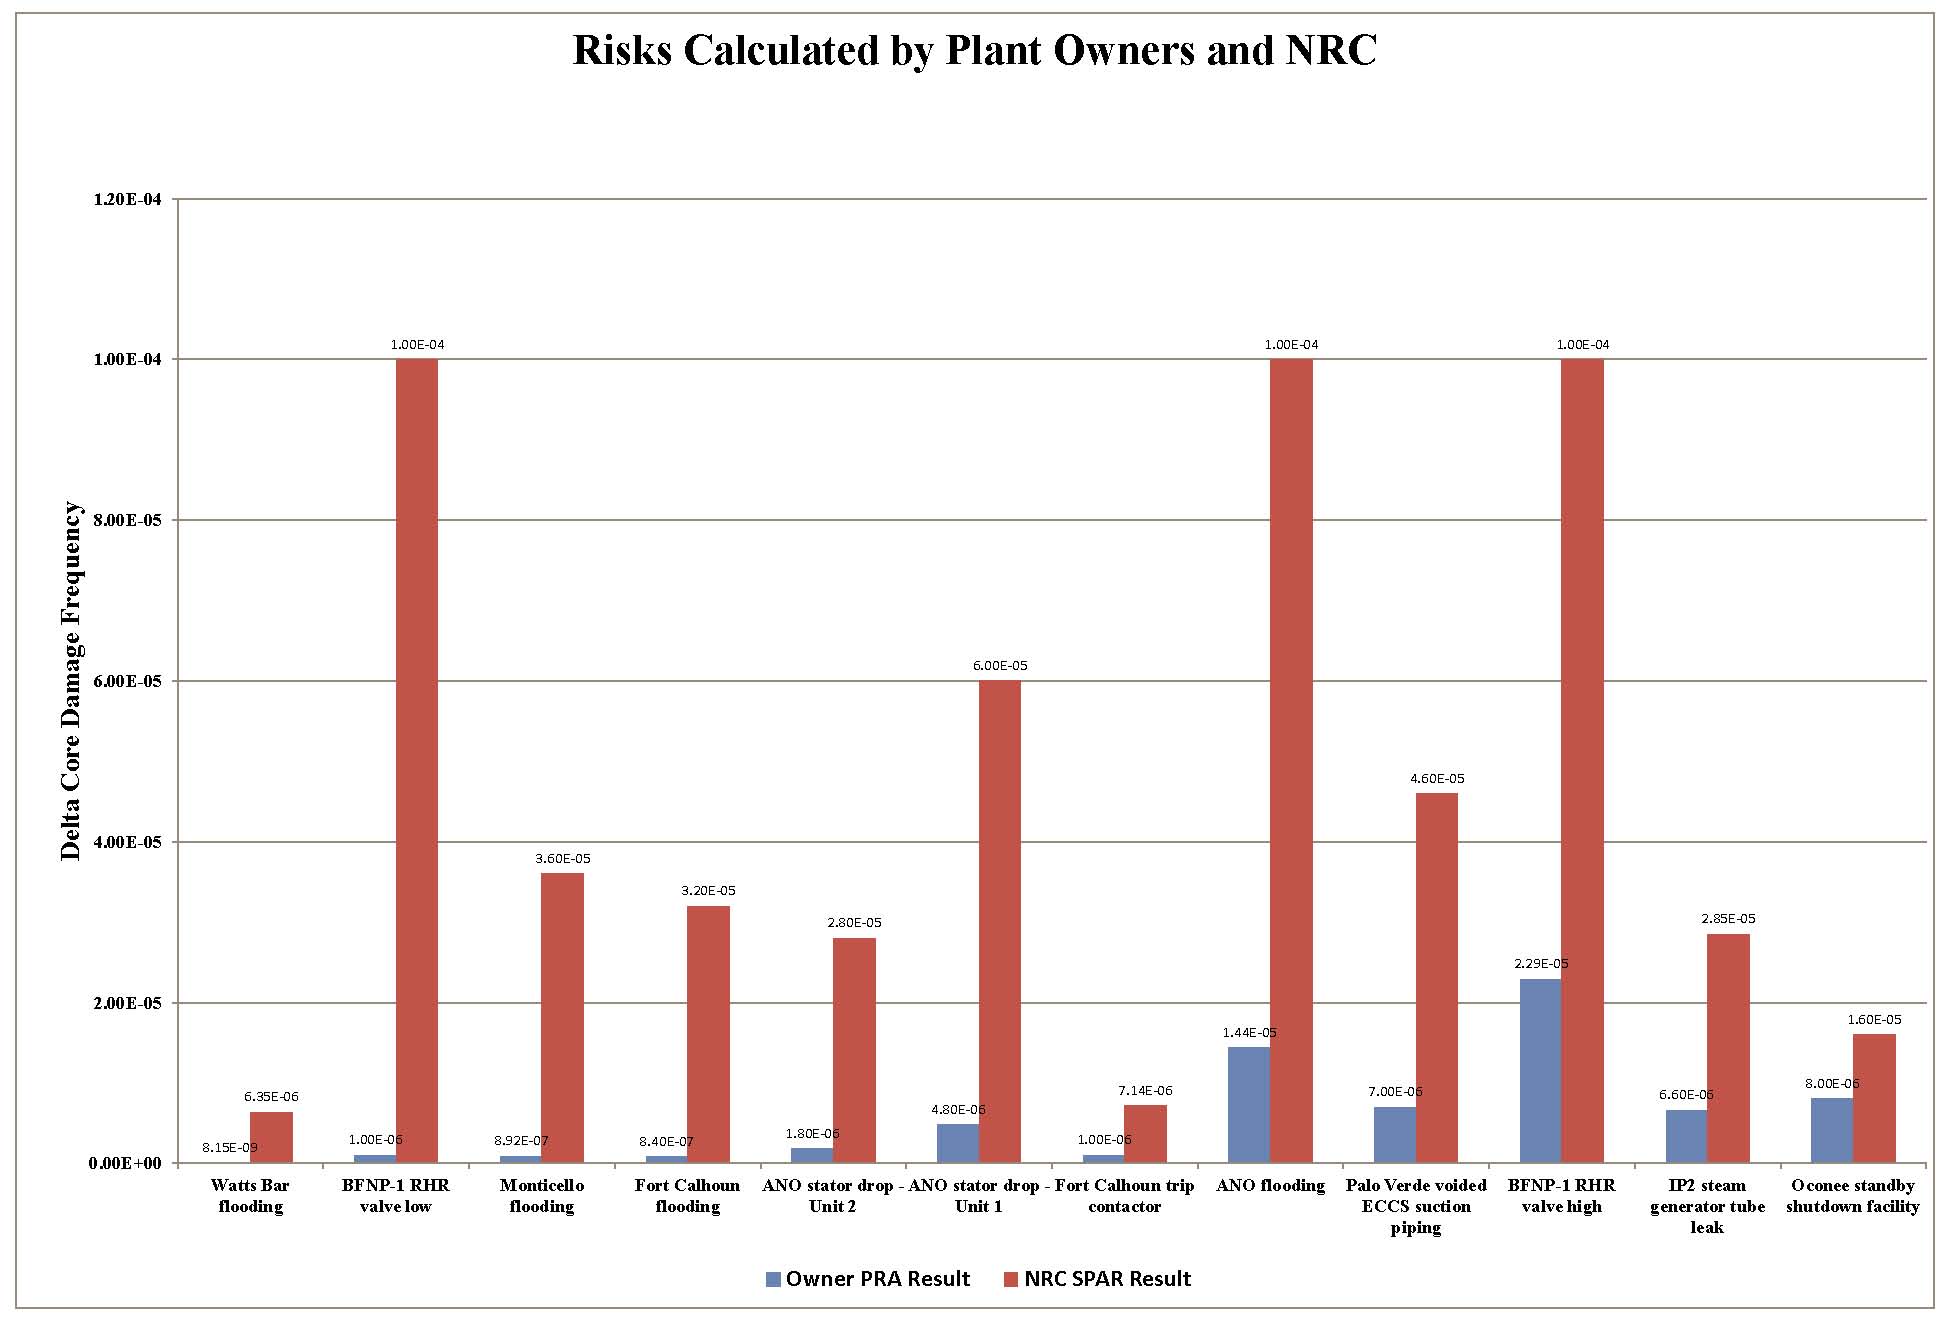
Fig. 5 (click to enlarge) (Source: UCS)
The closest agreement involved the standby shutdown facility violation at Oconee. The NRC’s calculated risk was only twice as high as the plant owner’s calculated risk.
The least agreement involved the flood protection violation at Watts Bar. The NRC’s calculated risk was nearly 800 times higher than the plant owner’s calculated risk.
The atomic speedometers and the nuclear radar guns either are not well calibrated or they are examining entirely different things!
To put this risk ciphering gap into perspective, let’s return to the speed limit analogy (see Table 1).
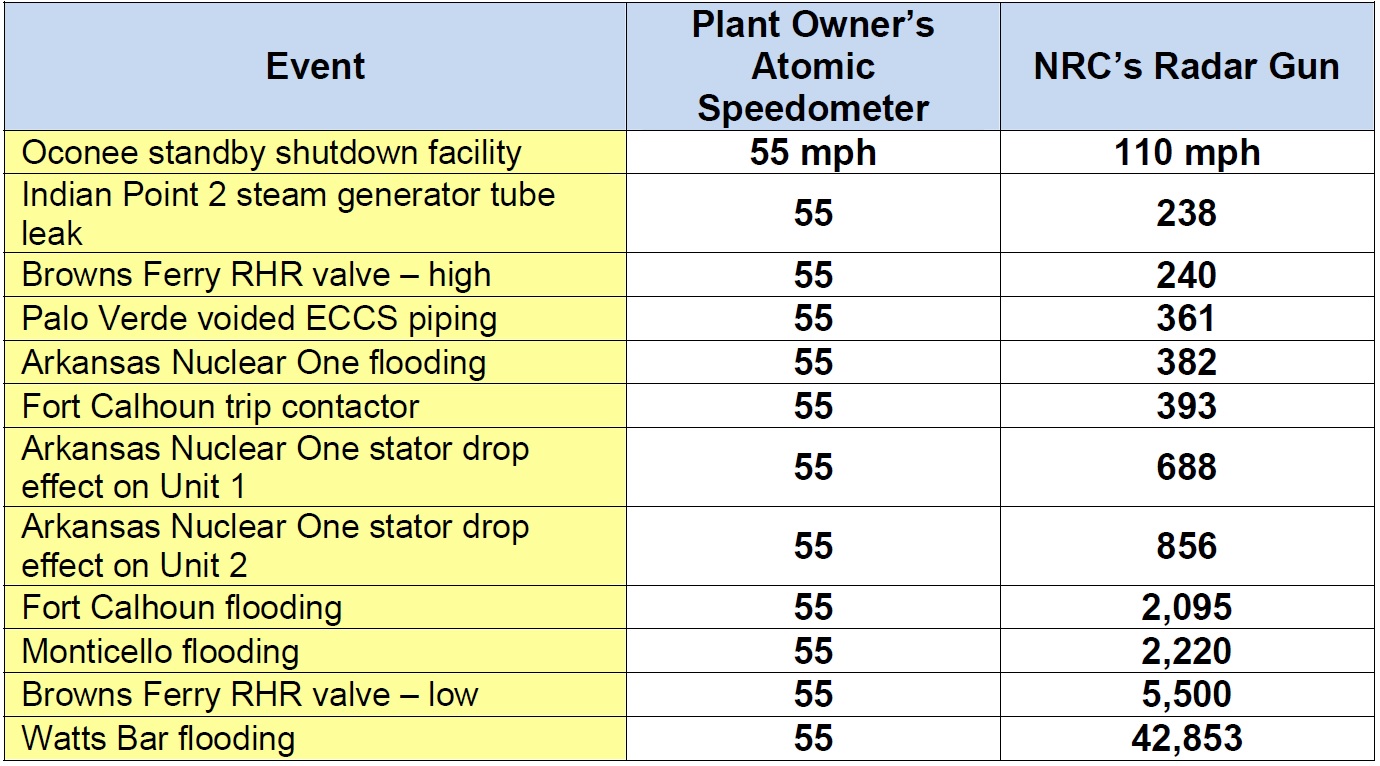
Table 1.
When Oconee’s atomic speedometer registered 55 miles per hour, the NRC’s radar gun clocked the reactor speeding along at 110 miles per hour. And that was the closest match
When Watts Bar’s atomic speedometer showed 55 miles per hour, the NRC’s radar gun indicated a smokin’ fast 42,853 miles per hour!
Our Takeaway
The posted speed limit, speedometer, and radar gun trilogy works because speedometers and radar guns yield reasonably comparable values. They would be entirely useless if a speedometer showed 40 miles per hour and a radar gun indicated 80 miles per hour.
Speaking of entirely useless, the PRAs and SPAR models cannot be used for anything other than amusing storytellin’ and non-productive time-wastin’ until their results have closer agreement. Differing by factors of 2 to 800 about risks doesn’t allow risk-informed decision-making. It supports risk-deformed decision-making.
For example, this chart is Figure 4 from the NRC’s Regulatory Guide 1.174. The horizontal axis across the bottom represents core damage frequency (CDF) that increases going from left to right. The 10-4 (or 1E-4) value in the center is the NRC’s subsidiary safety goal valve. CDFs to the left meet the goal; CDFs to the right do not meet it.
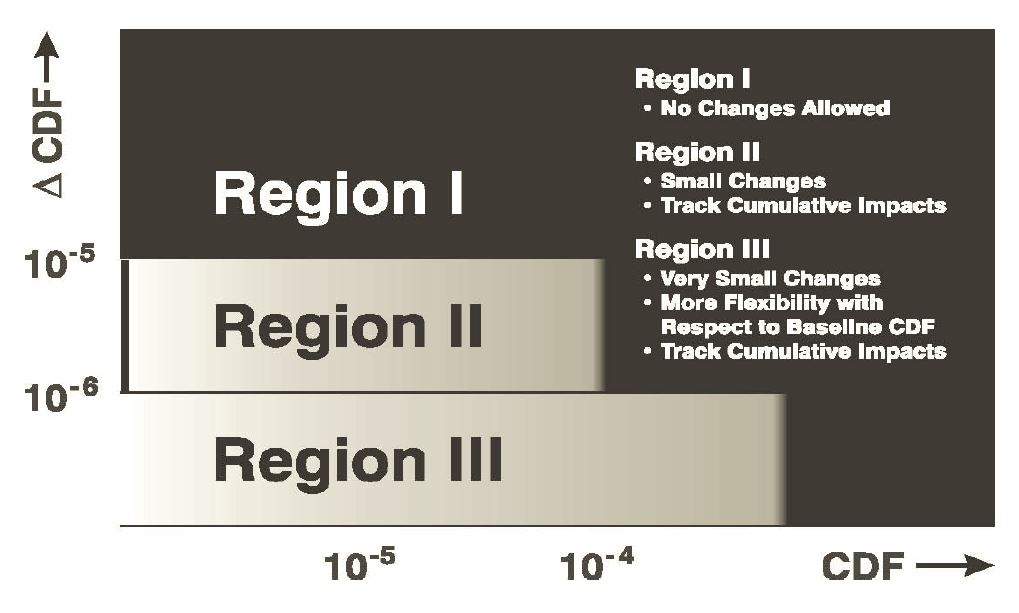
Fig 6. (click to enlarge) (Source: NRC Regulatory Guide 1.174)
The vertical axis along the left represents the “delta core damage frequency” (ΔCDF). The ΔCDF is the increase in the CDF caused by some actual or postulated condition. For example, the typical nuclear reactor has two emergency diesel generators to power essential equipment when normal power supplies are lost. Only one emergency diesel generator needs to run, the second is installed as a fully redundant backup to increase the chances that one works. The ΔCDF might be for removing one emergency diesel generator from service for maintenance longer than the outage time assumed in calculating the CDF.
Figure 4 governs when activities that increase CDF can be undertaken. When the CDF is low and the ΔCDF is also low, the placement in Region III means the change is acceptable.
But when the ΔCDF is large (i.e., in Region I) or the existing CDF is high (i.e. to the right of Region III), the change is unacceptable.
It makes sense. As the CDF increases, the amount of additional risk (ΔCDF) that can be tolerated decreases. At some point, the CDF becomes too high to allow any additional risk.
Conversely, as the CDF decreases, the amount of additional risk that can be tolerated increases. But the amount of additional risk at some point becomes too high to accept even when the CDF is quite small.
The large differences between the atomic speedometers and the nuclear radar guns render this chart useless.
The PRA and SPAR model results were ΔCDFs. Differing by factors of 2 to 800 mean that plant owners and the NRC literally are not on the same figure when it comes to determining whether ΔCDFs fall in Region III, Region II, or Region I.
It’s pointless to post speed limits and then rely on atomic speedometers and nuclear radar guns that disagree by so much.
No, it’s really not pointless. It’s just plain stupid.