
Fission Stories #171
The Fukushima disaster revealed many things: the unselfish sacrifices of workers who put duty ahead of their own safety and concern for their families, the vulnerability of reactor designs to severe challenges and common mode failures, the inadequacy of severe accident management guidelines, and the regulatory bias in risk assessments. This post speaks to this last revelation.
In the early days of the disaster, the NRC staff had limited information with which to understand conditions at the plant and recommend next steps. The NRC staff extrapolated from the scant data points to form a fuller picture. For example, the NRC staff concluded that the Unit 4 spent fuel pool lacked water and that the potential radioactive cloud emanating from the site warranted U.S. citizens evacuating out to 50 miles away.
The Japanese regulator had roughly the same incomplete situational awareness. Perhaps it had a few more jigsaw pieces than did the NRC staff, but neither had anywhere close to a full or even sufficient picture of the conditions. But the Japanese regulator used the same few data points to form an entirely conclusion—that the Unit 4 spent fuel pool retained some water and the situation posed no dire threat to people living 40 miles away.
Actually, this conflict stemmed from the biased evaluations by an entity tasked with managing risk and the evaluations by an equally competent entity unencumbered by this regulatory bias. The NRC could easily fill in data gaps with worst-case scenarios because doing so did not implicitly suggest poor performance on its part in the past. Likewise, the Japanese regulator could easily bridge data gaps with rosy forecasts because doing so reinforced the unstated belief that they could not possibly have been so wrong.
In other words, the disparity between assessments by the NRC and the Japanese regulator of essentially the same data was not due to different technical competencies or using Microsoft-based computer codes instead of Mac-based ones. Regulatory bias caused the different risk assessments. True, the NRC and its Japanese counterpart are both regulators; but the NRC staff was not wearing their regulatory hats when assessing the risk from the non-NRC licensed and regulated Fukushima reactors.
Regulatory bias also explains different risk assessment outcomes for U.S. nuclear power reactors. In domestic cases, the NRC wears its regulatory hat, causing it to bridge data gaps with rosy forecasts while external bias-free evaluators tend not to generate such optimistic assessments. Diablo Canyon illustrates this situation. When a new fault line was discovered in 2008 close offshore from the plant, the discovery opened a gap between data on the seismic protection levels and the seismic hazard levels represented by the new fault. The NRC recognized that more homework and analysis were required to understand this new hazard, but bridged this known information gap with a rosy guess that Diablo Canyon could operate safely in the meantime. Others, not biased to speculate that unperformed homework will prove all is well if ever completed, painted a more troubled picture.
Similarly, when cracked and leaking control rod drive mechanism nozzles were discovered at Davis-Besse in 2001, the NRC initially assessed the risk to be high enough to warrant an order requiring the reactor to be shut down. Then the regulatory bias kicked in to enable NRC’s senior managers to downplay the risk and let the reactor continue operating.
Our Takeaway
POP QUIZ: What picture do you see from these partially numbered dots?

(Source: State of California’s Energy Quest Campaign)
It is very common to lack all the dots and/or at least some of the right numbers for the available dots when trying to connect-the-dots for an evolving nuclear accident and for an unresolved nuclear safety problem. If all the dots and all their numbers were known, the accident would be mitigated and the problem would be resolved.
It is equally common that waiting until all the dots have been identified and properly labeled is seldom an acceptable option. Consequently, decision-makers must make do with existing data—as incomplete and inaccurate as it is.
Given that the picture drawn from existing dots might not match that drawn once all the dots are available and properly labeled, it is imprudent to rely on a single snapshot. Instead, one should seek the best picture the sketchy dots could yield, the worst picture, and the most likely picture.
The three guesses of the final picture could place the most likely picture closer to the best picture.
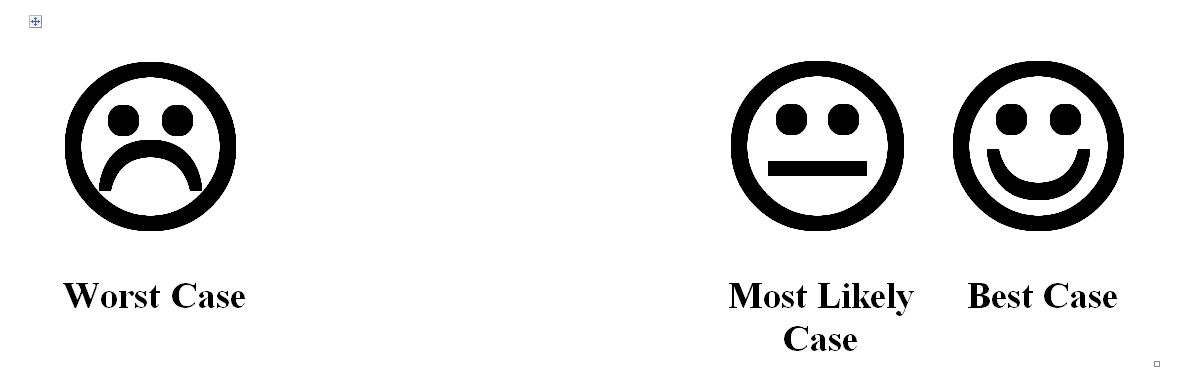
Or, the three guesses could place the most likely picture nearer the worst picture.
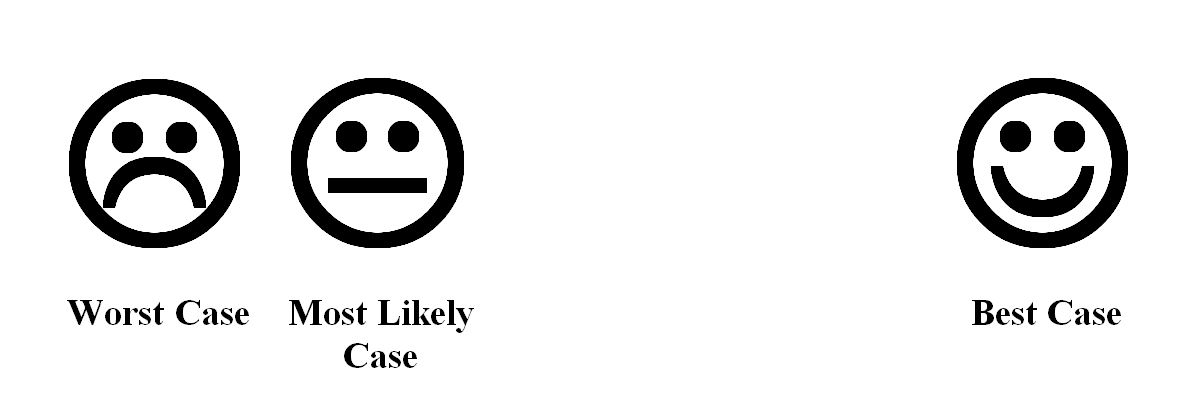
In either case, the fact that guesses are involved should instill urgency.
In the former case, the urgency is to complete the homework and analysis needed to find and label as many of the dots as possible to hopefully confirm the best picture scenario or leave as much time as possible to handle the bad picture that emerges.
In the latter case, the urgency is to implement contingency measures to mitigate the consequences of the worst picture scenario. If the guess of the most likely picture later turns out to have been overly pessimistic, any contingency efforts rendered unnecessary can be viewed as cheap insurance and/or as beneficial preparation exercises.
To check your connect-the-dot guessin’ skills, complete this fully populated and correctly labeled puzzle.

(Source: State of California’s Energy Quest Campaign)
“Fission Stories” is a weekly feature by Dave Lochbaum. For more information on nuclear power safety, see the nuclear safety section of UCS’s website and our interactive map, the Nuclear Power Information Tracker.