
Disaster by Design/ Safety by Intent #51
Safety by Intent
Last week’s commentary covered the NRC’s Maintenance Rule and expressed my perspective that it was the best thing the NRC has done over the past four decades. This week’s commentary describes my nominee for the second best thing—the Reactor Oversight Process (ROP).
Previous Oversight Processes (POP)
Letter grades
The NRC initially used a letter-grade system to rate safety performance levels at nuclear reactors. This system is familiar to schools students, except that it only allowed A, B, and C grades. An “A” reflected exceptional performance while a “C” indicated acceptable performance. The NRC did not explicitly define a “B,” but presumably it meant performance not quite exceptional but better than acceptable.
The lowest rating possible was a “C,” acceptable performance. So, allowing a reactor to melt down and spew radioactive material far and wide could, at worst, garner a “C” rating, perhaps even a “C-minus.”
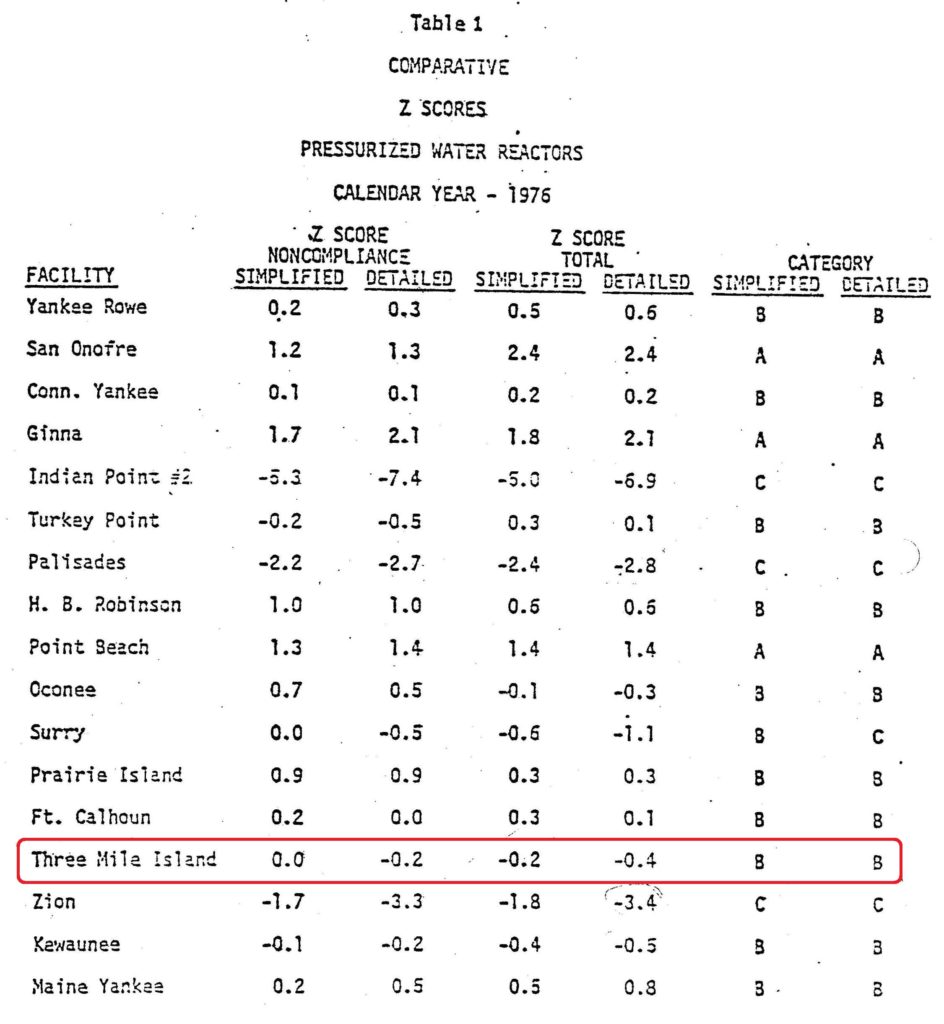
Fig. 1 (Source: NRC Memo dated September 26, 1977 annotated by UCS)
In grades issued by the NRC before the Three Mile Island meltdown, San Onofre (CA), Ginna (NY), and Point Beach (WI) earned straight A’s while Indian Point Unit 2 (NY), Palisades (MI), and Zion (IL) received C’s. Three Mile Island got B’s and soon suffered the worst accident, so far, in US nuclear power history. The NRC issued reactor report cards twice each year.
SALP
After the Three Mile Island meltdown, the NRC overhauled its rating system. The old letter-grade system was replaced with the Systematic Assessment of Licensee Performance (SALP) process.
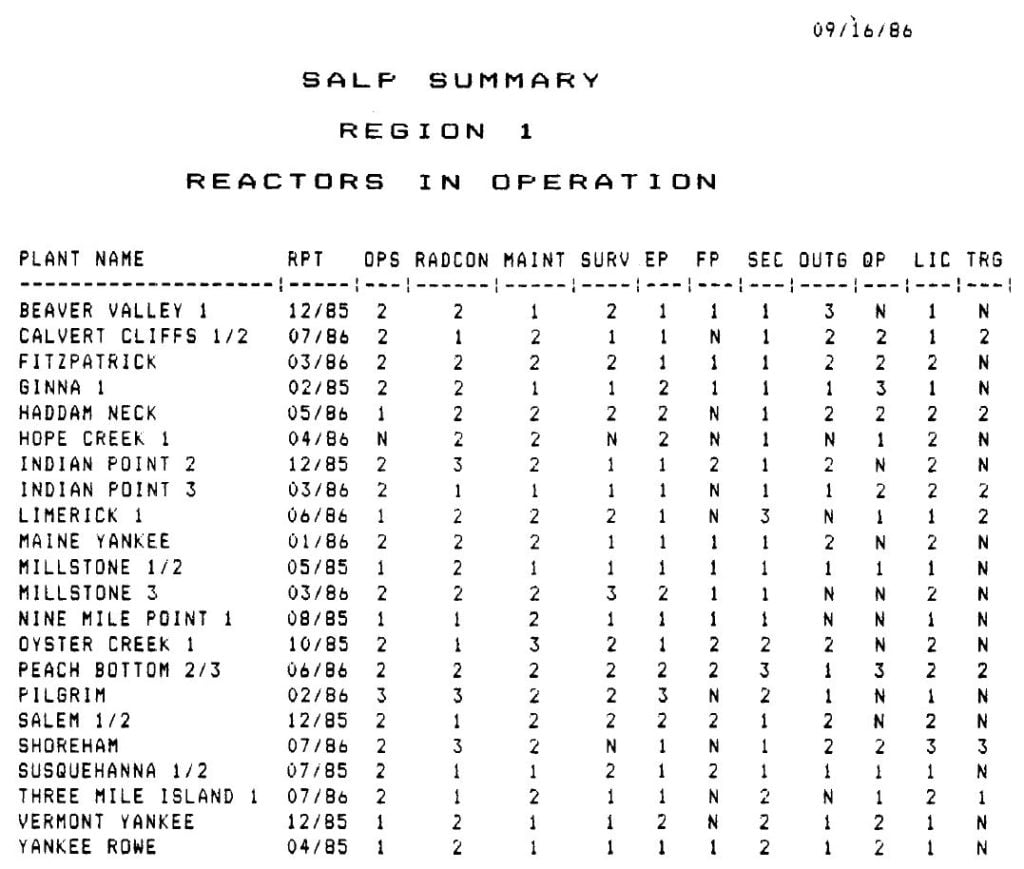
Fig. 2 (Source: NRC NUREG-1214 dated October 1986)
The SALP process was radically different. Rather than judging performance to rate A, B, and C grades, the SALP process defined performance levels as being 1, 2, and 3. “1” indicated high performance, “2” meant satisfactory performance, and “3” reflected acceptable performance. Totally different from the letter-grade system. And NRC issued the SALP ratings for each reactor once every two years instead of twice each year as for the letter grades. The 2 was retained, but moved from the numerator to the denominator in the NRC’s safety equation.
The lowest rating possible in SALP was a “3,” acceptable performance. So, allowing a reactor to melt down and spew radioactive material far and wide could, at worst, garner a “3” rating, perhaps even a “3-minus.”
That it didn’t take the NRC and the nuclear industry decades to transition from to old A, B, and C grades to the new 1, 2, and 3 scores shows how nimbly they can adapt to revolutionary changes.
Despite this radically new performance rating tool, the NRC remained unable to detect and correct declining performance until it plunged to extremely low levels. During SALP’s tenure, more than three dozen nuclear reactors had to remain shut down for over a year while an army of workers corrected enough safety problems to permit the reactors to be safely restarted. SALP’s death knell came when TIME magazine featured safety problems at Millstone on its cover in March 1996. The NRC proposed replacing SALP with IRAP, the Integrated Reactor Assessment Program.
IRAP
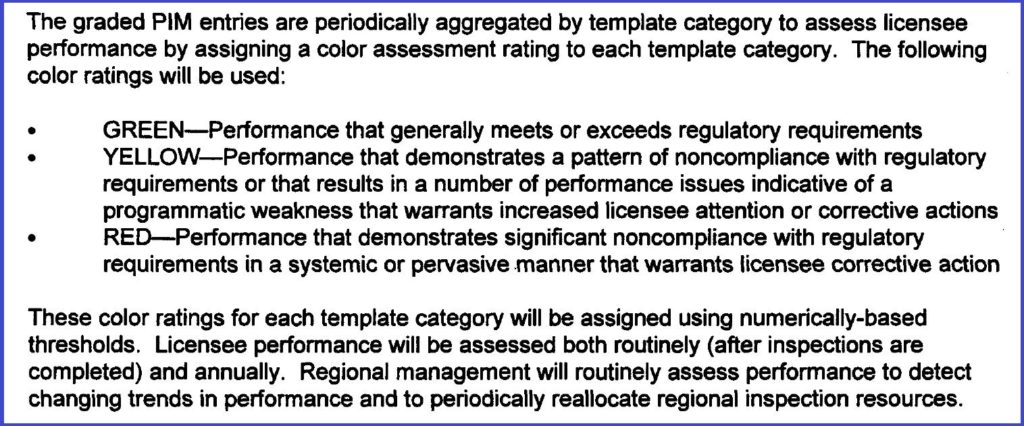
Fig. 3 (Source: NRC SECY-98-045 dated March 9, 1998)
IRAP featured another radical change to the performance rating system. Instead of SALP’s 1, 2, and 3 performance levels, IRAP would rate performance as being either Green, Yellow, or Red. (Apparently, the contingent within NRC favoring a furry critter rating system with Mink, Beaver, and Raccoon rating lost out to the color contingent.)
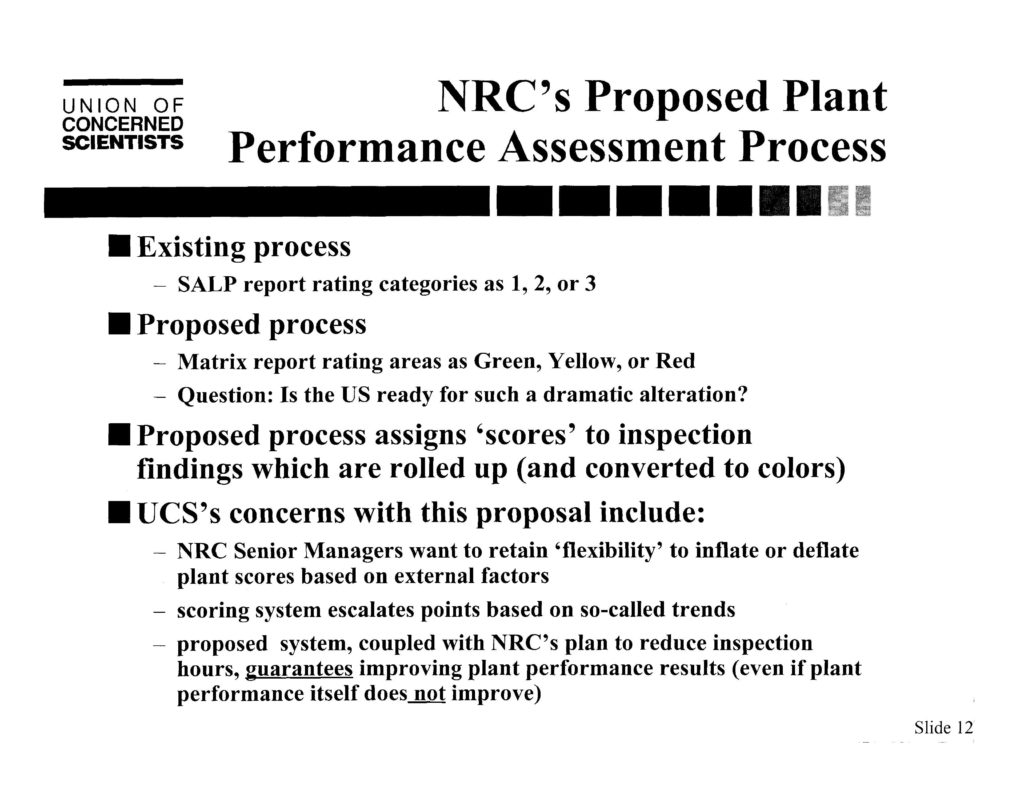
Fig. 4 (Source: UCS presentation to NRC Region I dated May 12, 1998)
NRC Region I invited me to present UCS’s perspectives at its conference in May 1998. I pleaded with the NRC not to make such a dramatic alteration to their oversight process. If they insisted on foisting such a radical change on the American public, I asked them to do so over three years: 1, 2, Red the first year, 1, Yellow, Red the second year, and then Green, Yellow, Red the third year so the public would have the chance to adapt to the massive changes.
Fortunately, the NRC Chairman and Commissioners shelved IRAP and directed the NRC staff to start over with a clean slate.
Reactor Oversight Process (ROP)
The NRC staff convened a four-day workshop in fall 1998. Hundreds of individuals participated in the workshop—NRC inspectors, NRC reviewers, NRC managers, industry representatives, state representatives, and public interest group representatives.
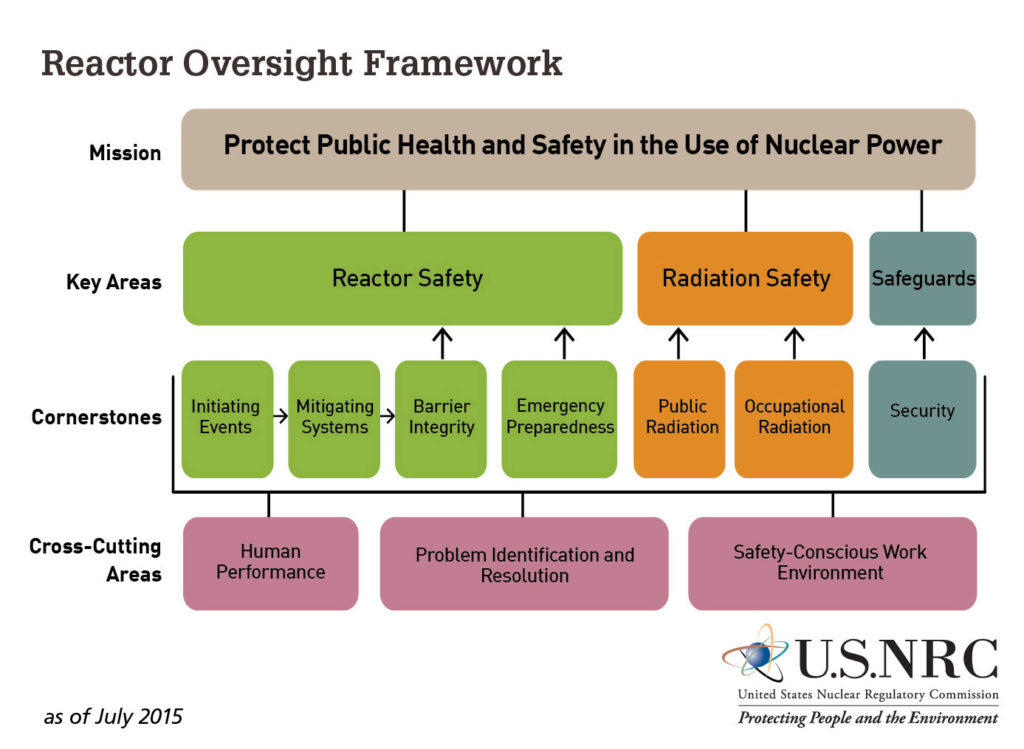
Fig. 5. (Source: NRC, Infographic of the Reactor Oversight Framework from the 2015-2016 Information Digest, NUREG 1350, Volume 27.
The NRC staff developed a regulatory framework as a straw-man for discussion during the workshop. That it was a pliable straw-man is evidenced by changes made as a result of concerns expressed during the workshop. For example, the cross-cutting areas of Human Performance, Problem Identification and Resolution, and Safety-Conscious Work Environment were not explicitly part of the initial regulatory framework. These areas were assumed to be implicitly included within the cornerstones.
The NRC staff proposed the ROP to its Commission in January 1999, which approved it in June 1998. The ROP was not assumed to be the intended solution. The NRC staff piloted the ROP at six reactors to road-test whether it lived up to its expectations without unintended consequences. The Commission approved nationwide implementation of the ROP beginning in April 2000.
ROP vs. POP
The ROP provides more discrete and timely assessments of performance than did any of its predecessors.
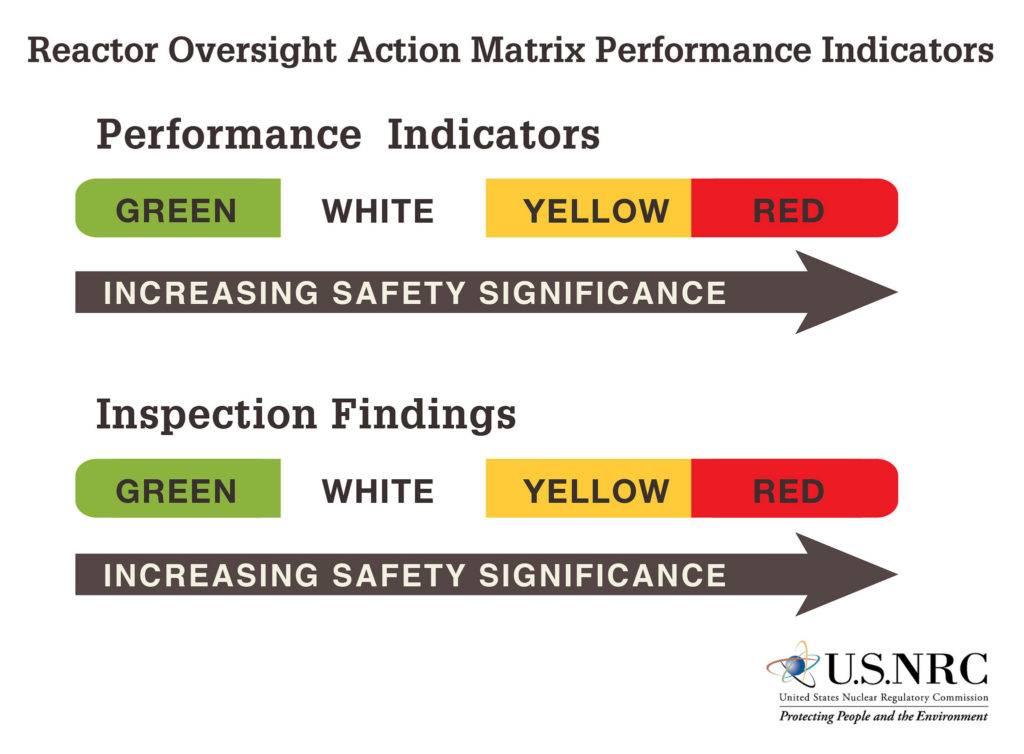
Fig. 6 (NRC Flickr Gallery)
First, in what I’ll term the UCS Concession, the ROP bins performance into four—not merely three—gradations. Performance Indicators are compiled by plant owners and submitted to the NRC each quarter. Performance Indicators monitor things like the number of unplanned shutdowns over the past eight quarters. The Green-to-White thresholds were established based on historical performance with the threshold drawn where 95% of the reactors were performing above the line. The White-to-Yellow and Yellow-to-Red thresholds were largely established to reflect higher risk levels.
Whereas ROP and SALP each rated performance in about seven categories (cornerstones in ROP, functional areas in SALP), the ROP further sub-divides these broad categories into smaller pieces. For example, there are currently 17 Performance Indicators for the ROP’s seven cornerstones.
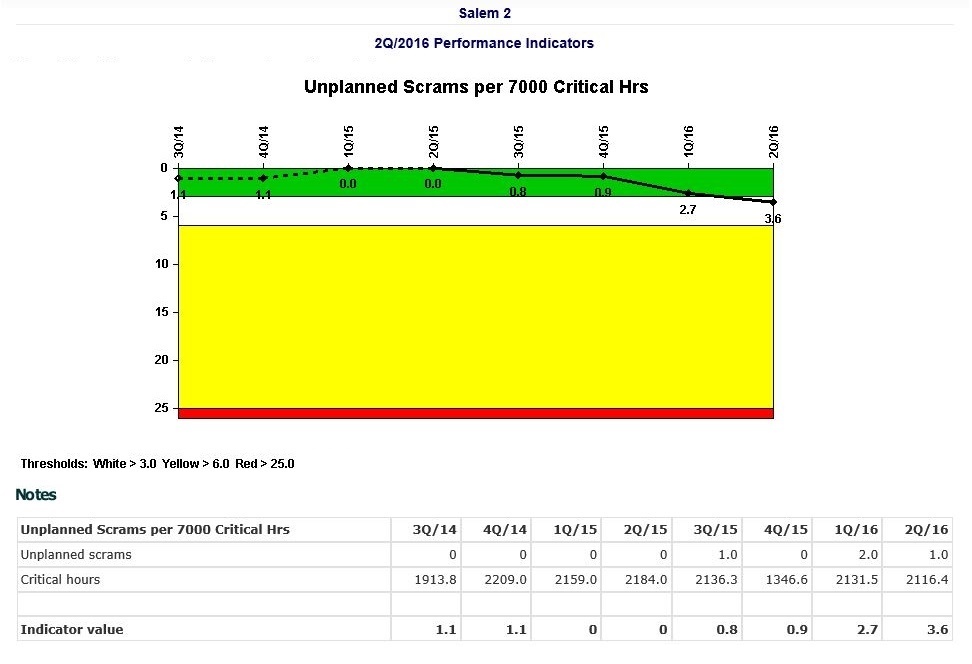
Fig. 7 (Source: NRC)
This chart shows the Unplanned Scrams per 7000 Critical Hours Performance Indicator as of the second quarter of 2016 for the Salem Unit 2 reactor in New Jersey. A fourth unplanned scram during the second quarter of 2016 pushed the indicator across the Green to White threshold. The White Performance Indicator raises a warning flag before performance declines incur risk consequences.
Whereas SALP rated performance for each reactor about once every two years, ROP rates every reactor every three months. The more frequent assessments detect declining performance earlier, which allows corrections to be made sooner.
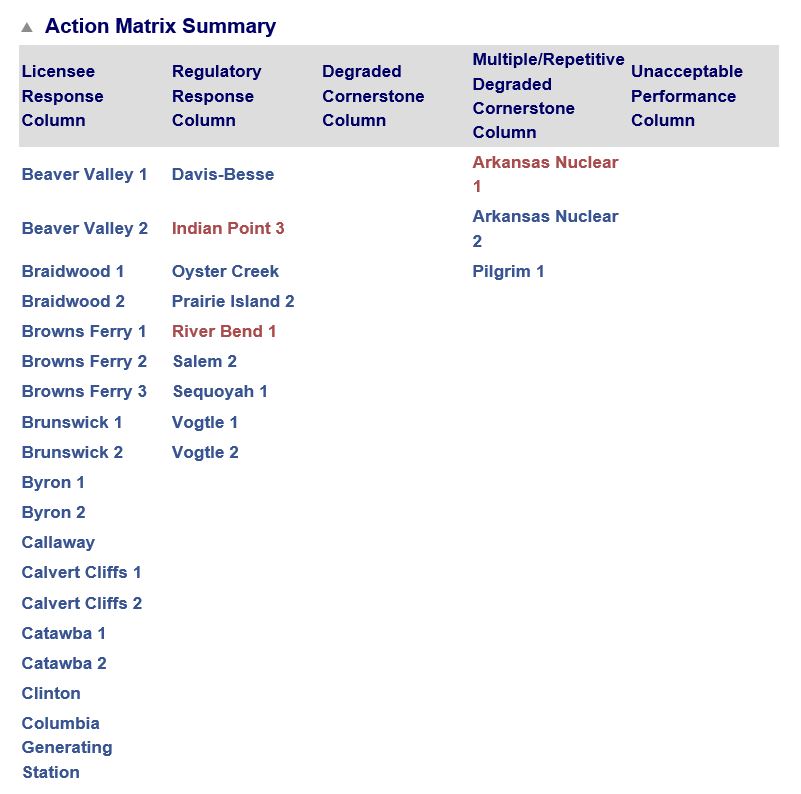
Fig. 8 (Source: NRC)
Low SALP scores could result in the NRC placing a reactor on its dreaded Watch List, the SALP process provided for little other than observation. Dresden (IL) was on the Watch List for nearly 8 of the SALP’s final 10 years.
The ROP forces the NRC off the bench and onto the regulatory playing field. As White, Yellow, and Red Performance Indicators and NRC Inspection Findings emerge, reactor performance moves leftward across the five columns of the ROP’s Action Matrix. Each column carries heightened NRC responses mandated by the ROP.
And performance leading to a reactor meltdown won’t elicit an “acceptable” rating (whether C, 3, Red, Raccoon or whatever). The ROP features an Unacceptable Performance column that requires the reactor to be shut down until its performance woes have been sufficiently corrected. Ask anyone working at Fort Calhoun between April 2011 and December 2013 whether the ROP is just semantic on this point. They might have been working, but Fort Calhoun certainly wasn’t.
Disaster by Design
On average, nearly two reactors were shut down each year during SALP’s tenure for outages lastly longer than a year to fix numerous safety problems. Only two reactors have been shut down longer than a year during ROP’s 16-year tenure. These facts might suggest that SALP was the more aggressive oversight program and that the ROP undermined the NRC’s regulatory effectiveness. On the other hand, the ROP may define NRC’s expectations more clearly and crisply, enabling owners to meet them more easily and NRC inspectors to detect shortcomings sooner. If so, more plants may avoid the accumulation of unresolved safety problems that ultimately requires lengthy and costly safety catch-up outages.
I view the ROP as being far superior to IRAP, SALP, and the NRC’s letter-grade systems. It is by no means perfect. But it is substantially less imperfect.
—–
UCS’s Disaster by Design/ Safety by Intent series of blog posts is intended to help readers understand how a seemingly unrelated assortment of minor problems can coalesce to cause disaster and how effective defense-in-depth can lessen both the number of pre-existing problems and the chances they team up.