
In August 2018, Georgia Power announced raised its estimate of the construction costs for its 45.7% share of the two new reactors being constructed at the Vogtle nuclear plant by $1.1 billion from $7.3 billion to $8.4 billion. Assuming the company lacked warehouses stuffed with money, the cost over-run raised an important question: has the hemorrhaging budget for constructing Vogtle Units 3 and 4 taken funding or distracted management attention away from the company’s operating reactors—Vogtle Units 1 and 2 and Hatch Units 1 and 2—and undermined their nuclear safety performance?
If asked, Georgia Power would certainly say “nope.” Because the company cannot forecast the cost of building reactors within a billion dollars or so, their skill at forecasting the necessary cost of operating reactors is questionable, at best. In other words, I didn’t ask Georgia Power.
Instead, I examined two data sets that provide more reliable insights on whether cost over-runs on Vogtle Units 3 and 4 have undermined safety performance of the company’s operating reactors. One data set was the quarterly performance ratings issued by the Nuclear Regulatory Commission (NRC) for every operating reactor in the country. The other data set was the reactor power levels reported each day by reactor owners to the NRC.
NRC Performance Ratings
In 2000, the NRC began assessing performance of every operating reactor every quarter using a combination of violations of regulatory requirements identified by NRC inspectors and about 24 performance indicators. When performance meets expectations, the NRC’s findings (if any) are green and the performance indicators are green. The further performance drops below expectations, the colors move from green to white to yellow to red.
Each quarter, the NRC uses the findings and indicators to place each operating reactor into one of five columns of its Action Matrix. When all expectations are met, reactors are placed in Column 1. As performance drops, reactors are moved into Columns 2, 3, 4, and 5. More than 80 percent of the time, NRC has placed reactors in Column 1. So, performance warranting a move out of Column 1 has been experienced, but most often avoided.
The NRC’s quarterly performance ratings between 2012 and the first half of 2018 for the operating reactors at Hatch and Vogtle are shown in Figure 1. Both the Hatch reactors remained in Column 1 the entire time. The two operating reactors at Vogtle dropped into Column 2 for a total of 8 of the 26 quarters. The good news is that Georgia Power was able to remedy the performance shortcomings to return the Vogtle reactors to Column 1. The bad news is that the Vogtle reactors are underperforming the U.S. nuclear fleet. The typical U.S. reactor received Column 1 performance ratings over 80 percent of the time. The Vogtle reactors were in Column 1 less than 70 percent of the time from 2012 onward.

Fig. 1 (Source: Union of Concerned Scientists)
Daily Reactor Power Levels
Each day, plant owners report the power levels their reactors are operating at. The NRC archives the reports and posts the daily reactor power levels over the past 365 days on its website. I used this data to plot the daily power levels reported for the Hatch Unit 1 and 2 reactors between 2014 and 2018 in Figure 2. The refueling outages conducted over this period are easy to spot—they are the wider white gaps preceded by a few days of gradually decreasing reactor power levels. Refueling outages commonly last three to four weeks. Figure 2 also shows a few other shorter outages and power reductions, especially on Unit 1.
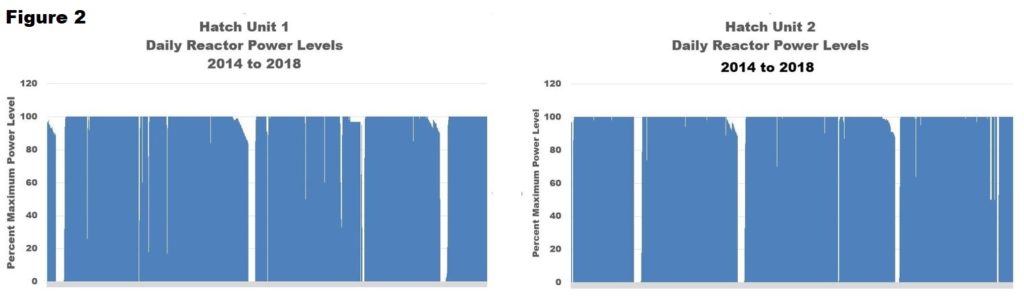
Fig. 2 (Source: Union of Concerned Scientists)
Figure 3 shows the daily power levels for the Vogtle Unit 1 and 2 reactors between 2014 and 2018. Again, refueling outages, non-refueling outages, and power reductions are evident in the plots.

Fig. 3 (Source: Union of Concerned Scientists)
The plots of daily reactor power levels may appear as insightful as the squiggles and blips are an EKG screen. To help put the plots for the Hatch and Vogtle reactors in context, the daily power levels for the Pilgrim reactor over the same time period are plotted in Figure 4. During most of this time, Pilgrim resided in Column 4. No reactor in the United States received lower performance ratings from the NRC during this period than Pilgrim.

Fig. 4 (Source: Union of Concerned Scientists)
What’s the difference between good performing reactors and Pilgrim? Pilgrim has fewer big blue rectangular blocks of operating at full power. Ideally, a reactor should run at 100 percent power from refueling outage to refueling outage, with only short-duration power reduction every quarter for testing. The more that the solid blue rectangles between refueling outages are splintered by unplanned shut downs and unwanted power reductions, the less ideally a reactor is operating.
UCS Perspective
The NRC’s quarterly performance ratings suggest the financial and management resources poured into the cost over-runs on Vogtle Units 3 and 4 have not undermined safety performance at Hatch Units 1 and 2.
The NRC’s quarterly performance ratings for Vogtle Units 1 and 2 paint a slightly different picture. Whereas the average U.S. reactor received Column 1 ratings from the NRC over 80 percent of the time, the Vogtle reactors got Column 1 ratings less than 70 percent of the time in recent years. But this situation is tempered by both reactors currently receiving Column 1 ratings. The Vogtle reactors under-performed the U.S. fleet, but not by a troubling extent.
The daily reactor power levels for the Hatch and Vogtle reactors also suggest that performance has not been appreciably undermined. The data do not suggest that the Hatch and Vogtle reactors have the performance shortcomings reflected by the daily reactor power levels for the Pilgrim reactor—the worst performing reactor per the NRC’s ratings—over the same period.
The NRC’s quarterly performance ratings are the public’s safety net. Insufficient budgets, inadequate management attention, aging equipment, and other causes can lead to lowered performance ratings. Lower performance ratings increase NRC oversight. The early detection and correction of performance shortcomings prevents problems from growing to epidemic proportions that invite disaster.
Unfortunately, the NRC is contemplating changes to its quarterly performance ratings and mandated responses that could cut holes in the public’s safety net. As nuclear plants age and their maintenance budgets shrink, the NRC needs to strengthen rather than weaken the most reliable tool it uses to protect public health and safety—timely, reliable and accurate performance ratings.