
In my previous post, I looked at what we could learn about North Korea’s Musudan (Hwasong-10) missile from the lofted flight it launched on June 21. In this post, I look at some other aspects of the test.
Intentionally lofted?
One question has been whether the lofted trajectory the North Korean launch followed was intentional. The Korean news agency KCNA implied it was, saying in a statement “The test-fire of Hwasong-10 was carried out by the high-angle fire system under the simulation of its maximum range.”
In addition, Dave Schmerler at the Monterey Institute pointed out to me that the computer screen on the far right of this photo of Kim Jong Un celebrating after the successful test, shows the lofted trajectory.
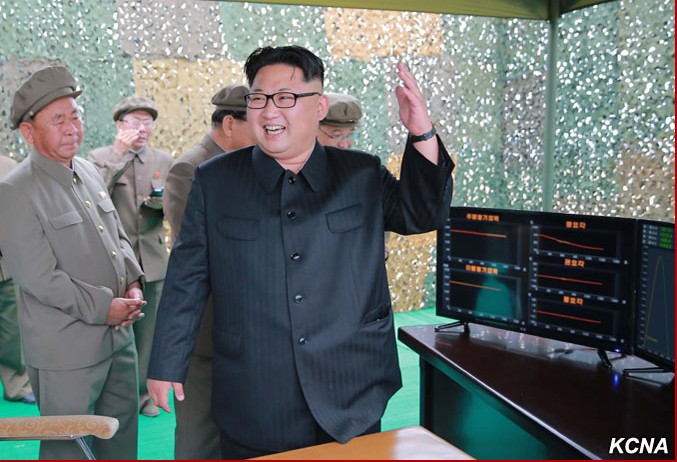
Fig. 1 (Source: KCNA)
From a higher resolution version of the image, Dave was able to read off two sets of parameter values—one set that appears to be the values intended for the launch and the other the actual values achieved in the launch. They are close to each other and close to the values I find in my calculation of the trajectory. Unless this information was planted in the photo after the launch to hide a malfunction, this strongly suggests this was the intended trajectory.
It’s worth noting again that based on the performance of the missile on this trajectory, it would not have the range to reach Guam. If flown on a standard trajectory, this missile would have a range of roughly 3,000 km, which is less than the 3,400 km distance to Guam. It’s interesting to note that the KCNA statement quoted above says the test simulated the missile’s maximum range.
Testing the heatshield
The lofted trajectory allowed North Korea to test the missile’s guidance and control system, and also to test the reentry heatshield under conditions similar to those the missile would experience during reentry on a standard 3,000 km range trajectory. Those conditions, however, would be significantly less severe than for reentry of a 10,000 km range missile. So based on this test Pyongyang could gain confidence that its reentry vehicle (RV) would work on a 3,000 km range missile, but it would not know whether the heatshield would work on a long-range missile.
Fig. 2 compares the reentry heating on several different trajectories.
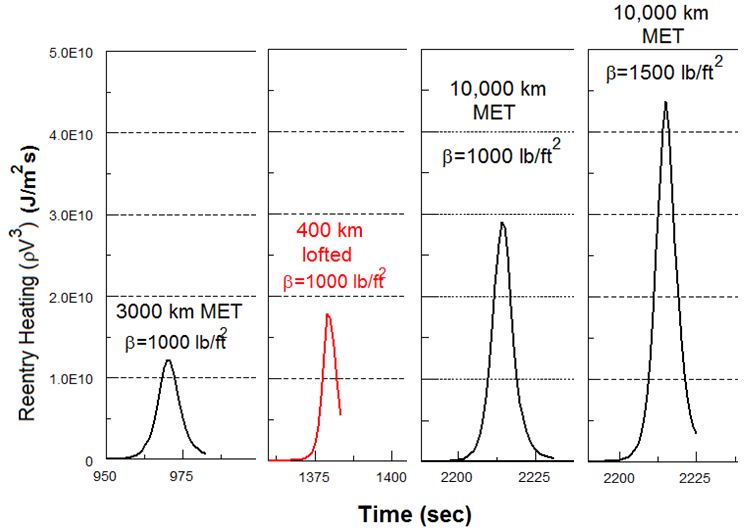
Fig. 2 This figure plots ρV3 for reentry in four different cases, where ρ is the atmospheric density and V is the RV’s speed. This quantity is roughly proportional to the heat absorbed per area and per second by the RV. Here β is the ballistic coefficient of the RV. The time scales on the x-axis are the same for the four curves, but the flight time of the missiles is different so the time at which they reenter is different for each missile. “MET” is “minimum-energy trajectory,” which is the standard trajectory used to maximize range.
A reentering warhead accelerates under the force of gravity until it gets low enough in the atmosphere that drag starts to slow it down. The kinetic energy that is lost as it slows is transformed into heating of the air around the warhead. This leads to intense heating of the surface of the RV and causes heat to flow into the interior the RV toward the warhead. The RV heatshield has to be designed to accommodate the very high temperatures at the surface and limit the heat flow to the warhead, which could cause damage.
The rate of heat transfer to the RV goes roughly as ρV3, where ρ is the atmospheric density and V is the velocity of the RV. Since longer range missiles reenter at higher speeds, the heating rate increases rapidly with missile range. In particular, the maximum value of V3 is more than four times larger for reentry of an RV on a 10,000 km range trajectory than on a 3,000 km range trajectory.
Fig. 2 shows plots of ρV3 against time for three different trajectories and two RVs. The peak of the curves gives the maximum heating rate and is related to the maximum temperature the surface of the RV is subjected to. The length of time significant heating occurs is related both to how much heat the RV absorbs and how long the heat has to flow inward from the surface toward the warhead. The other quantity of interest is the total amount of heat absorbed during reentry, which is related to the area under the curves in Fig. 2. That quantity is a measure of the total heat load the heatshield is required to withstand.
The red curve corresponds to the Musudan test on the lofted trajectory. Fig. 2 shows that this trajectory subjects the RV to a somewhat higher peak heating than the Musudan on a standard 3,000 km range trajectory (labeled MET). However, the heating occurs over a somewhat shorter time for the lofted trajectory compared to the standard trajectory, so the total heating is nearly the same in the two cases: 1.1 x10¹¹ J/m2 for the 3,000 km range trajectory compared to 0.93 x10¹¹ J/m2 for the lofted trajectory. So if the heatshield worked on the lofted trajectory it should work on the 3,000 km range trajectory.
However, the same RV on a 10,000 km trajectory (3rd curve from the left) would experience much higher peak heating than the red curve. Its total heating of 2.5 x10¹¹ J/m2 is more than two and a half times larger than experienced by the Musudan.
North Korea could reduce the heating on a long-range missile by making the RV much more blunt, so that the higher drag would slow it at higher altitudes. That would mean the atmospheric density ρ would be small when the velocity V is largest.
In particular, North Korea could design an RV with a lower weight-to-drag ratio, also called the ballistic coefficient (β). The calculations for the three curves on the left in Fig. 2 assume β = 1000 lb/ft2 (48,000 N/m2), which appears to be a good estimate for the RV seen in pictures of the Musudan (this assumes a mass of 650 kg and drag coefficient at high speeds of about 0.15). If instead the North increased the drag of the RV to give β = 400 lb/ft2 (19,000 N/m2), the total heating on a standard 10,000 km range trajectory would be 1.0 x10¹¹ J/m2, which is similar to the heating on the Musudan above.
However, increasing the drag can significantly reduce the accuracy of the missile since its slower reentry speed means the atmospheric forces that pull the RV off its intended trajectory act on the RV for a longer time. The resulting inaccuracy could be many tens of kilometers, which may still be adequate for hitting a large city but could reduce confidence in using the missile.
Instead, to reduce the inaccuracies of a long-range missile, North Korea would likely want to reduce the drag and increase β to allow the RV to pass through the atmosphere more quickly. Modern US RVs have values of β in the range of 2,000-3,000 lb/ft2 (100,000-150,000 N/m2). However, if North Korea increased β for its long-range missile warhead to 1500 lb/ft2 (72,000 N/m2) the peak heating would be much higher and the total heat would increase to 3.6 x10¹¹ J/m2; this case is shown by the curve on the right in Fig. 2. (The total heat for a given range scales roughly with β.)
(For more information on atmospheric heating at high speeds, see here, p. 149-50).